
How to prioritise development in a BI Project
When your organisation sets out on the path to deliver a Business Intelligence project it is likely you will create a long list of requirements. The next challenge is identifying what to deliver and when. Setting out a road-map can often be based on the demands of the end users (or the 'demanding' end user). The risk is that you try to deliver too much, too early and end up overwhelming the developers and delivering a lower quality.
When we work with our clients, we always encourage them to be comfortable setting out a road-map that allows them to walk before they run. Pick important projects that are lower in complexity first and leave the more difficult ones for later in the process. This approach means you deliver something valuable early that is relatively easy to deliver, lowering the risk of failure. It is also likely this will help feed into and iron out issues of larger more complex requirements that come later in the project.
How to use the Priority/Complexity Matrix
Step 1. List and code your requirements
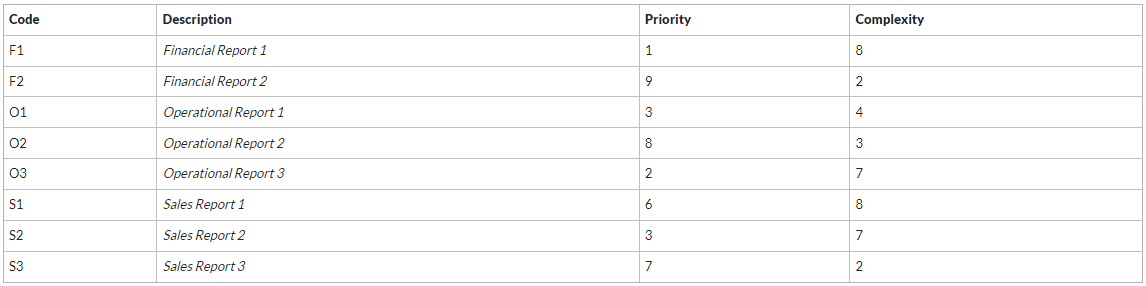
The first step is to list all your requirements. When looking at reporting requirements you would list each full report required to be delivered. To code your requirements, you can simply use numbers, or you could add additional coding to define things like Business Unit, data category etc. Your list would look something like below
F1 – Financial Report 1
F2 – Financial Report 2
O1 – Operational Report 1
O2 – Operational Report 2
O3 – Operational Report 3
S1 – Sales Report 1
S2 – Sales Report 2
S3 – Sales Report 3
Step 2. Define each project Priority and complexity
Now take each of these reports and list the priority and the complexity of delivering the project. Take into consideration all the parts of the project, for example.
Complexity
access to and complexity of the data,
the difficulty of the reporting visualisation elements,
the volume of data and visualisation requirements
Priority
The priority of the report in relation to business needs
The priority due to demands from stakeholders
Now rank each on a scale of 1 to 10 – 1 being low, 10 being high
Step 3 – Plot each on the Matrix
The next step is to plot each of the requirement on the matrix along the scales as defined by the values you have given them in the previous step.

Step 4 – Pick off your requirements and deliver
Based on the example above we would recommend picking reports from the box highlighted in grey. Those High Priority / Low Complexity Tasks that will deliver value to the business while being lower risk and easier to deliver.
